


HOMES FOR SALE
MARCH 2019
HOMES FOR SALE

IN CONTRACT

SOLD LAST MONTH

AVG PRICE PER SQ.FT
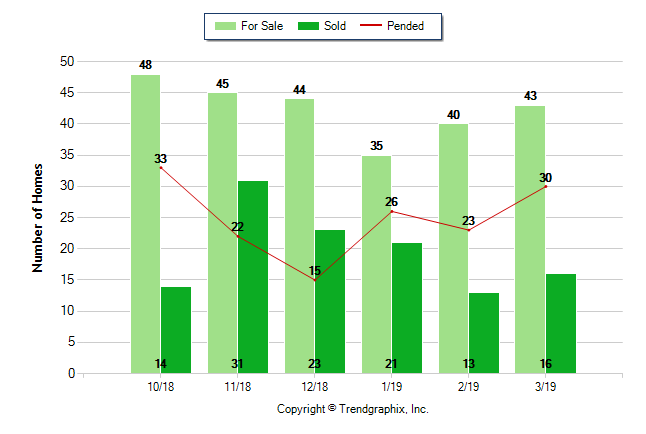
The number of for sale listings was up 7.5% from the previous month. The number of sold listings increased 23.1% month over month. The number of under contract listings was up 30.4% compared to the previous month. The Average Sold Price per Square Footage was down 6.7% compared to the previous month
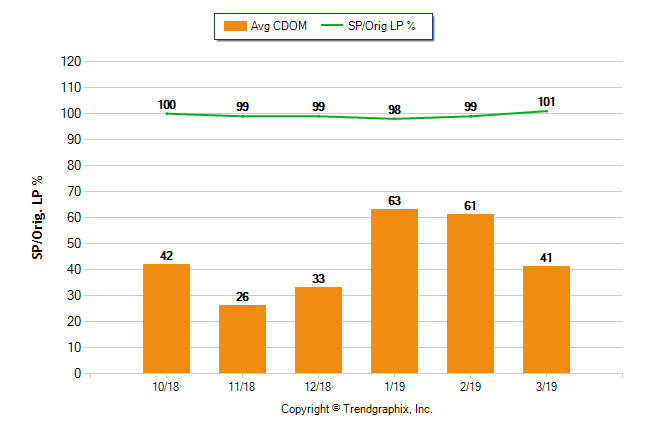
The Days on Market Shows Neutral Trend* The average Days on Market (DOM) shows how many days the average property is on the market before it sells. An upward trend in DOM tends to indicate a move towards more of a Buyer’s market, a downward trend indicates a move towards more of a Seller’s market. The DOM for March 2019 was 41, down 22.6% from 53 days last month.

Get your home's value - our custom reports include accurate and up to date information.