Do you want content like this delivered to your inbox?
Share
Share

January 2022 Silicon Valley Area Market Report

Donny Piwowarski

In the heavily competitive real estate market, an agent has to work hard to find ways to differentiate himself from the competition...

In the heavily competitive real estate market, an agent has to work hard to find ways to differentiate himself from the competition...

Feb 14 7 minutes read
The Big Story

New Year, Same Housing Market

Quick Take:
  • Historically low supply continues to drive up home prices across the nation. However, home price increases are decelerating after the record-setting gains experienced over the past two years.
  • The number of homes sold in 2021 is one of the highest on record.
  • Current inflation levels imply a negative borrowing rate because mortgage rates are below 6%. This means that borrowers are getting paid to borrow and should pay as little principle as possible until inflation recedes.
  • The average 30-year fixed mortgage rate remained historically low, at 3.11% at the end of December 2021. But the Fed has indicated there will be at least two rate hikes in 2022.
Note: You can find the charts & graphs for the Big Story at the end of the following section.

Will the housing shortage reverse?

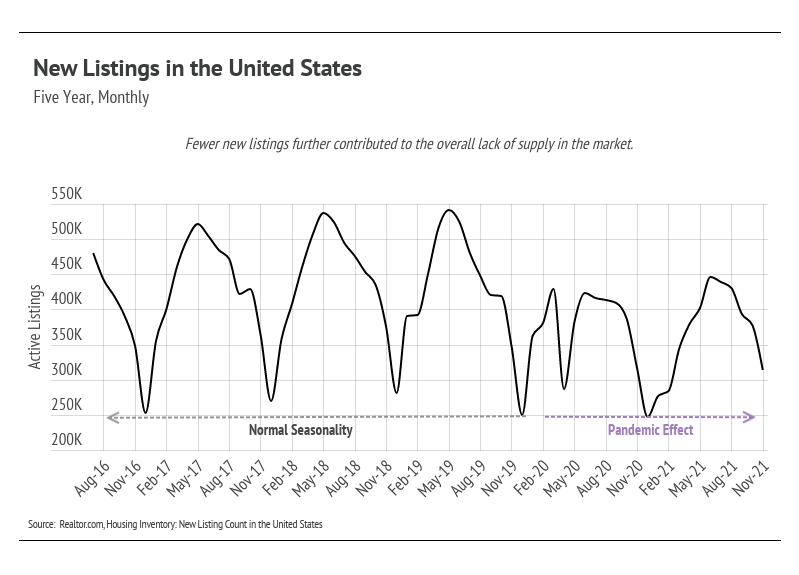
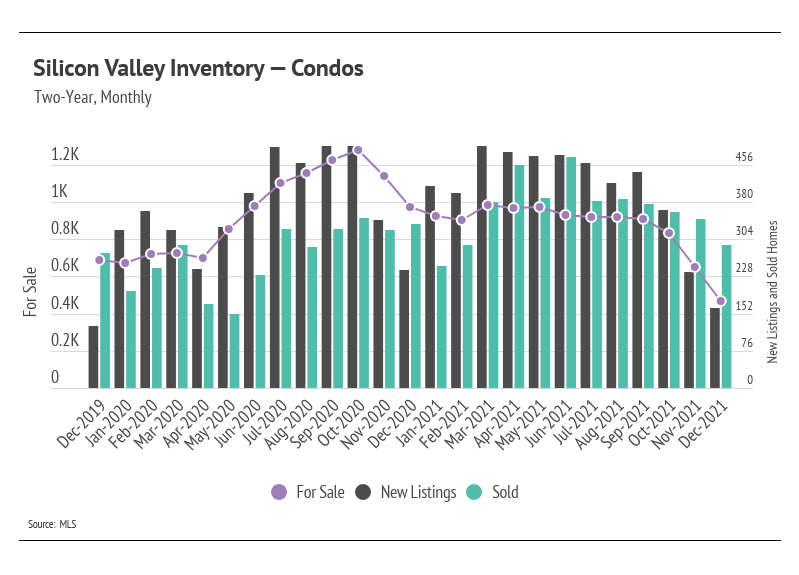
The driving force behind the substantial price increases over the past two years has been the supply of homes, or lack thereof. So, will the housing shortage reverse? The answer is no, as there is no reasonable scenario that would bring active listings to pre-pandemic norms. Before February 2020, seasonal inventory typically peaked in the summer months, but it was trending slightly lower each year. In 2016, inventory peaked at 1.55 million active listings, and by 2019, the peak fell to 1.35 million homes. Inventory in 2021 reached its highest point at approximately 621,000, a 54% decline over two years. Homebuilders simply cannot build fast enough, especially in sought-after urban areas that have already been developed, and new listings are peaking far lower than the historical seasonal norms.

At the same time, we are on pace to see around a million more homes sold in 2021 than in a typical year, based on the long-term average. In other words, more homes are selling, despite the historically low inventory, which is further driving down inventory. In 2022, we expect demand to remain elevated and supply depressed, which should keep home prices from depreciating.

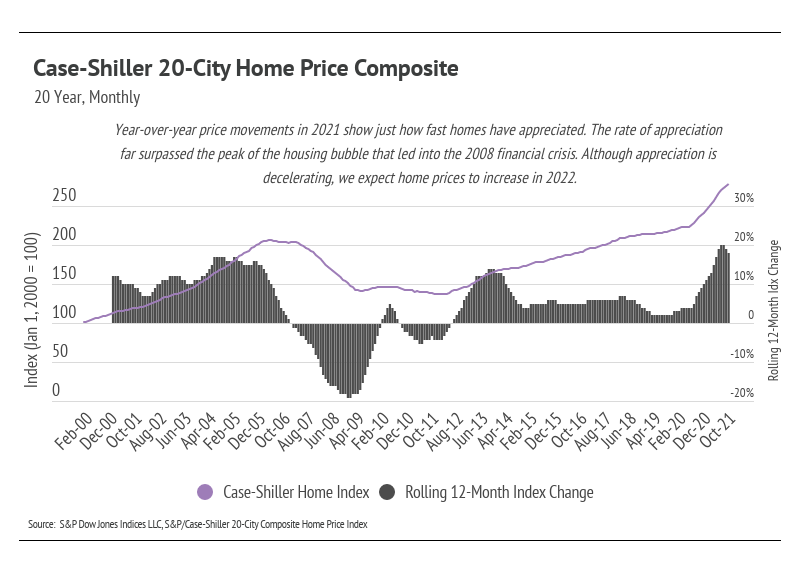
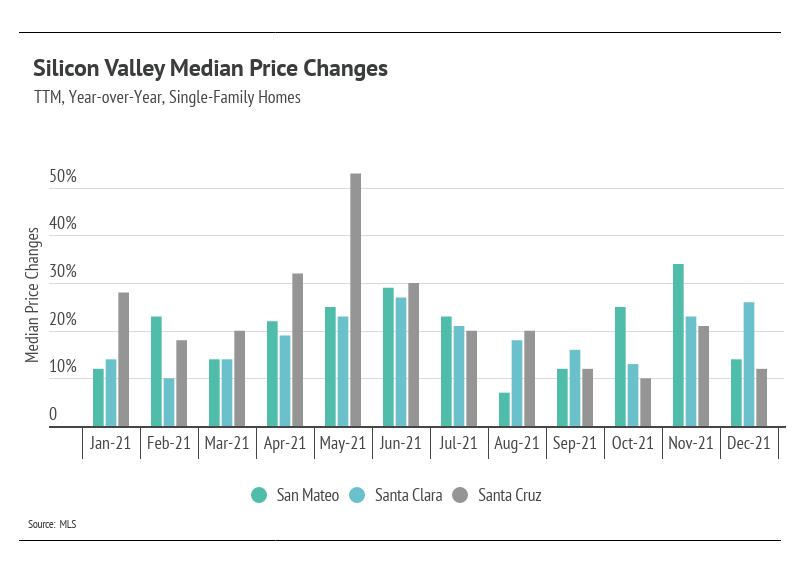
Price appreciation likely will not see the record gains we experienced over the past two years, which is actually good. If we learned one thing from the mid-2000s, we know that we don’t want another housing bubble. The deceleration in price increases, therefore, actually benefits the current market. From a practical standpoint, home prices rising at 20% per year is unsustainable and would certainly cause a major collapse. Moving through 2022, we expect year-over-year price increases to move back to historical norms, in the 5–10% range.

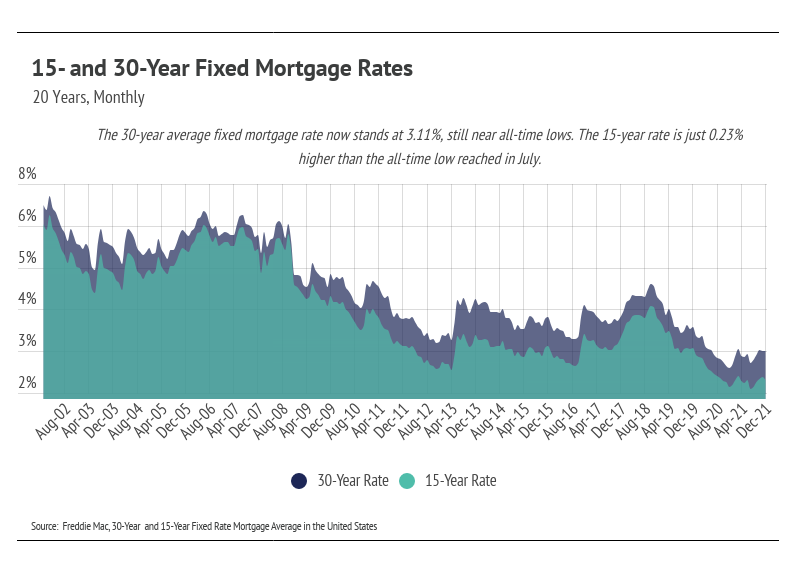
Fed rate hikes in 2022 could drastically affect appreciation as well, which, again, isn’t a bad thing. The low-cost financing we’ve seen over the past two years could be coming to an end (although it’s difficult not to take a believe-it-when-I-see-it-approach to rate increases). When we account for current inflation, which is the highest it’s been since 1981, the real rate of borrowing is negative if you borrow at a rate below 6.8%. Simply put, you’re getting paid to borrow! We don’t expect this phenomenon to last long — it’s a fairly unique situation.

The market remains competitive for buyers, but conditions are making it an exceptional time for homeowners to sell. Low inventory means sellers will receive multiple offers with fewer concessions. Because sellers are often selling one home and buying another, it’s essential that sellers work with the right agent to ensure the transition goes smoothly.
Big Story Data

The Local Lowdown

A cooling market means more room to run in 2022

Quick Take:

  • Single-family home prices and condo prices increased significantly in 2021. Home prices rose across counties:
    • San Mateo County: +14% for single-family homes; +5% for condos
    • Santa Clara County: +26% for single-family homes; +18% for condos
    • Santa Cruz County: +12% for single-family homes; 0% for condos
  • Despite historically low inventory, the increase in home sales and speed of sales reflect the high demand in Silicon Valley.
  • Months of Supply Inventory further indicates a sellers’ market.
Note: You can find the charts/graphs for the Local Lowdown at the end of this section.

Home prices still have room to run in 2022 

After the rapid price appreciation of single-family homes in the first half of 2021, it makes sense that price increases would slow in the second half. Although no market was at an all-time high in December, Silicon Valley home prices remain historically high, but year-over-year price appreciation is decelerating. We expect price appreciation will be more muted as we make our way through the winter months, and then pick up again in the spring and summer seasons.

Like single-family homes, condo prices in Santa Clara increased considerably in 2021 and reached an all-time high in December. Santa Cruz County condo prices declined sharply in December, bringing prices flat for the year. With fewer single-family homes on the market, we are seeing higher demand for condos.

The Silicon Valley market does seem to be cooling, which is a seasonal norm this time of year. However, with inventory at record lows, we could easily see prices start to rise once again in 2022, especially in the spring and summer seasons.

Back to record low inventory

Despite the slight increase in single-family home inventory in the first half of 2021, the sustained high demand and lack of new listings in the second half brought single-family home and condo supply to historic lows. Once again, we are seeing that far more people want to live in Silicon Valley than want to leave. Sales in Silicon Valley have been incredibly high, especially when accounting for available inventory, again highlighting demand in the area. Sellers can expect multiple offers, and buyers should come with competitive offers.

Months of Supply Inventory further indicates high demand

Homes are still selling extremely quickly, indicating the high demand in Silicon Valley. Buyers must put in competitive offers, which, on average, are 3–6% above list price.

Months of Supply Inventory (MSI) quantifies the supply/demand relationship by measuring how many months it would take for all current homes for sale on the market to sell at the current rate of sales. The average MSI is three months in California, which indicates a balanced market. An MSI lower than three indicates that there are more buyers than sellers on the market (meaning it’s a sellers’ market), while a higher MSI indicates there are more sellers than buyers (meaning it’s a buyers’ market). Currently, single-family home and condo MSIs are both historically low, strongly indicating a sellers’ market.
Local Lowdown Data


Curious about what
your home is worth now?

We're able to explain what these numbers mean for you and your home's current market value. 

We use cookies to enhance your browsing experience and deliver our services. By continuing to visit this site, you agree to our use of cookies. More info